boehm_chart.gif
Vertical Load and Traction
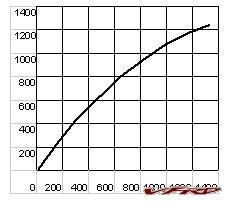
Notice in the graph of vertical load vs. traction force, as the vertical load on a tire increases, traction goes up, but the percentage of traction force decreases, effectively reducing the g?s a car can generate. For example, if this tire has 500 lbs. of vertical load on it, it can generate 660 lbs. of traction force, or 1.32 g?s (660 / 500 = 1.32).
If the load were 800 lbs., the traction force would be 925 lbs., but only 1.16 g?s (925 / 800 = 1.16). This is the tire?s traction potential. As you will see, for any of several reasons, it will usually be less. This line can move around relative to the graph based on several conditions such as camber, ambient temperature, tire temperature and track surface condition, and obviously the type of tire. It will never be straight, however because the relationship is not linear.


Recommended Comments
There are no comments to display.
Join the conversation
You can post now and register later. If you have an account, sign in now to post with your account.